Risk-Based Integrated Cost and Schedule Analysis for Infrastructure Projects
Key processes necessary to identify and manage risks on complex projects have been developed over the last 20 years to implement risk-based approaches for better cost and schedule estimation. Cost and schedule, however, were mostly treated separately instead of integrating them into one model. This integration is highly relevant as schedule delays are very often the root cause for severe cost overruns. This paper therefore presents a fully integrated, probabilistic cost and schedule model to add a powerful tool for the management of complex risk environments.
1 Introduction
Significant progress has been made over the last 20 years in the identification, characterization, mitigation and management of risk for complex projects. Risk guidelines have been developed (ITA 1992, 2004; ITIG 2006, 2012; Reilly 2001, 2003, 2008, 2013; Goodfellow & O’Carroll 2015) and are more routinely applied with increasing success, such that the general process and application of risk management principles are now generally clear. During this period, specific applications and detailed tools have been developed to assist with risk identification, characterization and mitigation, such as:
- Risk-based cost estimating, e.g., WSDOT’s CEVP® cost estimating/cost validation/risk management process (Reilly et al. 2004)
- Risk management processes and procedures (ITA 2004, ITIG 2006, Reilly 2008, Goodfellow & O’Carroll 2015)
- Streamlined software applications and integrated systems, e.g., RIAAT 2017, that allow efficient application of risk-based processes including risk characteristics (probabilities and consequences), correlations, interdependencies, linkage, risks occurring multiple times and schedule/critical path analysis (Sander et al. 2016)
The most recent step in advancing such risk-based methods was to add full risk-based critical path schedule and cost integration. This is the subject of this paper.
2 Integrated Cost and Schedule Model

Figure 1: Waterfall diagram for cost component structure, planning phase (a), construction phase (b), project completion
2.1 Cost-Risk Approach
Formerly, cost estimates, usually deterministic with quantities and unit prices, accounted for risk based on the estimator’s experience and best judgment without fully identifying and quantifying risks. Such program uncertainties were included in a general “contingency” to account for uncertainties. The judgment of the level of such contingencies was related to the level of definition of the estimate (Estimate Classes as defined in AACE International 2016).
In CEVP (Reilly et al. 2014), estimates are comprised of two components: the base cost component and the risk component (see section 2.2). The base cost does not include “contingency” but does include the normal variability of prices and quantities. Once the base cost is established, a list of risks is created and characterized (probability, consequence) by the project team, including both opportunities and threats, and are listed in a risk register. This risk assessment replaces general and vaguely defined contingency with explicitly defined risk events that include the associated probability of occurrence and impact on program cost and/or schedule for each event.
The base cost is developed by the project team/estimator and is validated by an experienced cost estimator. The risk assessment is developed in a cost risk workshop by a set of participants including the project team, subject matter experts and experienced risk elicitators.
2.2 Cost Components
- Introducing a clear cost component structure allows for cost transparency and cost control. Cost components that need to be addressed in the estimate are:
- Base cost – the cost if “all goes according to plan” without contingencies
- Risk cost – the cost resulting from threats and opportunities that might occur
Escalation cost – additional costs resulting from inflation
A best practice cost component structure for different project phases is shown in Error! Reference source not found.. It consists of actual cost without uncertainties (left part of the waterfall diagram: B0, A, I – Baseline Cost) and uncertain components (right part of the waterfall diagram: B*, R, E – Uncertainties). The sum of the uncertain cost components is also called delta cost and is used for allowing for inclusion of uncertainties in the project budget. While uncertainties are high in early project phases, they reduce to zero upon project completion. Escalation (prediction for inflation) becomes indexation cost (contractual clause for compensation for inflation) and realized risks result in actual additional cost.
RELATED: Agenda Set for Risk Management in Underground Construction Course

Figure 2: RIAAT – Process – (1) Base cost estimate is reviewed, associated with uncertainties and integrated into the WBS. (2) Risks are assessed (cost & time impact) and integrated into the WBS. (3) Risks are assigned to tasks in the project’s schedule. Subsequently, completion date, critical paths and delays from risks are simulated. (4) Cost impact from time delay is calculated with time-related cost and integrated into the WBS. (5) Project Cost including uncertainty is available on all WBS levels and for all cost components.
2.3 RIAAT – Risk Administration and Analysis Tool, Process
The process used for the integrated cost and schedule model is shown in Figure 2. In the first step, Base Cost is estimated and validated, subjected to uncertainties, and integrated into the Work Breakdown Structure (WBS). Subsequently, identified risks and a markup for unknowns with cost and time impacts will be assessed and integrated into the WBS and the construction schedule.
RELATED: Contractor Prequalification Can Be an Effective Risk Management Tool – If Properly Applied
A probabilistic simulation of the construction schedule incorporates all risks with associated time impacts. The results include a construction completion date, delays with respect to specific milestones, critical paths and near-critical paths. The results of the construction schedule are linked back to the WBS, where the time impacts can be associated with time-related costs to evaluate the cost impact of program delays.
If RIAAT software (RIAAT 2017) is used, there will be a hierarchical project structure, full MS Excel import/export, advanced risk modeling and numerous options for visualization. Construction schedules are fully integrated into the software. Risks are assigned to tasks of the schedule from the project tree using drag-and-drop; updated simulation results are obtained within seconds and available “live” during workshops. Figure 3 shows the main interface of RIAAT, the subsequent figures in this paper were generated using RIAAT.
3 Case Study – Construction of a Base Tunnel

Figure 3: Sample main interface, RIAAT risk software
3.1 Project Description
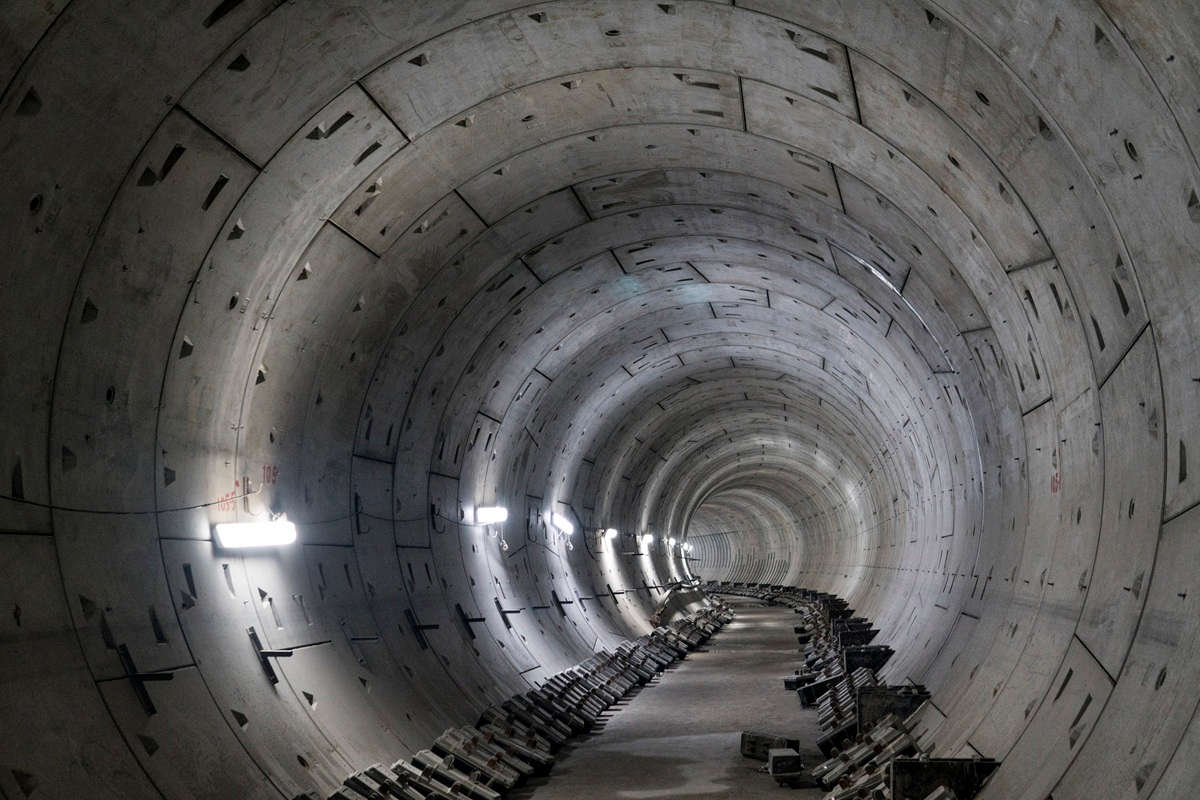
A fictitious sample project is used in this paper to illustrate the process. It is based on experience from major European railway base tunnels. This 14-km, twin-bore tunnel consists of several tunnel boring machine (TBM) drives as well as drill-and-blast (D&B) drives in different geological formations, an access shaft, an emergency stop, various cross cuttings and (optional) inner linings. A linear project schedule is shown in Figure 4. In RIAAT, the base schedule is modeled as a Gantt diagram (Figure 5). The deterministic critical path is shown in red.

Figure 4: Linear base schedule – horizontal axis: station, vertical axis: time
3.2 Base Cost and Risk Register
A deterministic base cost estimate is made by the design firm. It is reviewed, discussed and validated with the project team and a bandwidth is assigned to account for minor variability in the base cost estimate. Subsequently, risks are identified and assessed in moderated workshops with the project team and subject matter experts as described in section 2.1. The process is structured using “risk fact sheets” to gather and systematize information such as risk description, qualitative and quantitative assessment, risk strategy and risk mitigation measures. The

Figure 5: Base schedule in RIAAT, deterministic critical path without risks is shown in red
quantitative assessment typically consists of either probability of occurrence (0–100%) or expected rate of occurrence (e.g., 1, 2, 3, etc., modeled with a Poisson distribution) and cost/time impact using a three-point estimate (best, most likely and worst case). Complex risks (e.g., dependencies) can be modeled using event or fault trees (ETA, FTA). The risk register is updated during the workshops to give the project team a clear picture of the ongoing process.
Table 1 shows the quantitative assessment of the top 10 risks. Figure 6 shows the same risks in a range impact diagram to illustrate the full bandwidth of

Table 1: Sample quantitative assessment of top 10 identified risks
each risk. Risks that are assigned to more than one task will be dependent (i.e., the risk will impact both tasks in the same way). The importance of the capability to model dependencies in schedules was explained by Dorp and Duffey (1999). Independent risks such as “Main Bearing Damage” for four different TBMs are modeled separately to ensure independency. For clarity, similar independent risk events are not displayed in Table 1 and Figure 6.

Figure 6: RIAAT Range impact diagram for top 10 identified risks, bandwidth: VaR5¬¬¬–VaR95
Range Impact Diagram
Range impact diagrams are used to compare risks with respect to their cost or time impact (in this case time). The width of each bar represents the bandwidth of a risk impact from the best case (left end of bar, VaR5) to the worst case (right end of bar, VaR95). Each colored section represents a probability of 10%. The left end of Risk No. 1 (TBM Main Bearing Damage) represents VaR80. This is because the probability of occurrence is as low as 20%. Hence, any probability lower than 80 equals to zero. The % value indicates the chance that the respective risk will be on the critical path.
After the risk register is complete, all risks with time impact are assigned to the base schedule (Figure 7). The colors indicate the type of assigned risks, in this case blue for owner risks, green for contractor risks and purple for tender risks (pre-contract). The length of each task is not a deterministic number anymore, it contains uncertainties and is thus represented with a distribution function. Due to the assigned uncertainties, different critical paths become possible. The probabilities of occurrence for various critical paths are calculated using Monte Carlo Simulation.
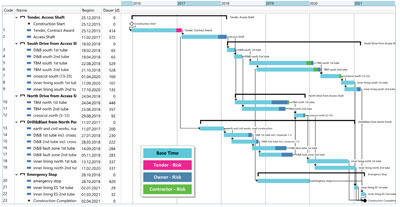
Figure 7: RIAAT schedule with assigned risks, colors indicate risk impact
4 Results
Simulation results for the critical paths are shown in Figure 8. Each color indicates one critical path. A task with more than one color is part of more than one critical path, e.g., the task “Tender, Contract Award” is made up of all colors. Hence, it is part of all possible critical paths. A graphical example for interpretation is given in Figure 9. In this example, there is a 60% chance (blue + yellow) that the completion date will be determined by the TBM south drive, but there is also a 30% chance (green + red) that the TBM north drives will become critical. The D&B drive from the north portal only has a 12% chance of becoming critical. This will be the case when the fault zone turns out to be much longer than expected (risk 7).

Figure 8: Results of critical path simulation in RIAAT, each color indicates one possible critical path
The construction completion date and the deviation to the original construction completion milestone of the base schedule are shown in Figure 10. Direct time-related cost that is caused specifically by one risk event is calculated within the risk itself (see Table 1). In addition to that, a delay on the critical path causes additional time-related cost. This cost is now calculated using the overall project delay on the critical path. In this case, this was done by taking into account only the portion of the critical path delay caused by the owner’s risks (see Figure 11).

Figure 9: Interpretation of critical path simulation results
After including time-related cost, a probabilistic cost forecast for all cost components can be made. The results are shown in Figure 12. The vertical blue line represents the deterministic base cost without uncertainties. Taking into account uncertainties related to the base will result in the blue curve. Adding risk cost results in the red curve. Finally, escalation cost is added to obtain the total project cost. Delta cost is obtained by comparing the total project cost with the deterministic base cost. In this case, a certainty level of VaR80 was chosen to determine the project’s budget.

Figure 10: Construction completion date (left), Deviation to milestone (right)
5 Discussion
The above describes a clear risk process that, in general, is being used by a significant number of projects and agencies in the planning and design phases. The CEVP-RIAAT process can be used to establish a realistic budget (e.g., setting the budget for a program of projects at the P80 level – an 80% chance that the projects will be delivered at or under this number; a 20% chance that they will be delivered over this number). The P-level will depend on the historical experience of the agency and if the project is a large complex project – perhaps P80 (Reilly 2016) or a set of smaller more routine projects – perhaps P60.

Figure 11: Delay on critical path from owner’s risks is multiplied with time related cost and added to the overall risk cost of the project
Beyond the planning and design phases, the use of RIAAT will enable tracking progress, construction change orders and cashflow with a risk-based approach. Integrated change order management can be applied, and probabilistic look-aheads can be used to update the project’s budget certainty. Changing P-levels (initial P80 budget decreases to P30/initial P80 increases to P95) are paramount for controlling the project’s budget, i.e., increasing or reducing it.

Figure 12: Probabilistic project cost (Base Cost, Risk, Total Project Cost)
Advances in risk-based cost and schedule estimation and management are being implemented due to more widespread recognition of the need to apply risk-based methods, the advantages of using such processes and the publication of risk guidelines by international associations (ITA, ITIG), as well as U.S. federal and state agencies. Application of these principles and process has been approved and is being used by major U.S. government agencies (FHWA, FTA, Corps of Engineers, state departments of transportation) and they are also being applied internationally.
RELATED: Risk Management in Tunneling from the TBM Manufacturer’s Perspective
6 Conclusions
A software-supported risk process was presented on a sample tunneling project that has the capability to enhance risk-based project management in the U.S. and internationally. The main conclusions are:
- A fully integrated cost-schedule model is available that can analyze risk impact on construction schedules and can enable the integration of delay cost.
- Probabilistic schedule simulations can be used to determine major critical paths and their respective probabilities.
- Model results can be used for budgeting in the planning and design phases.
- Budget control with integrated risk/change order management can be used during execution.
Philip Sander and Martin Entacher are with RiskConsult GmbH (www.riskcon.at; sander@riskcon.at, entacher@riskcon.at); John Reilly is with John Reilly International (www.JohnReilly.us; John@JohnReilly.us); and Jim Brady is with Aldea Services (www.Aldeaservices.com; jbrady@aldeaservices.com)

Comments are closed here.