Tests of Fixed Fire Fighting System in the Northern Link Tunnel

Two sections of the new fixed fire fighting system in the Northern Link tunnel activated.
The Northern Link tunnel in Stockholm was recently opened for traffic. This 4-km long road tunnel system is one of the largest and most complex in Europe. A new sprinkler fire‑fighting system has been installed throughout the tunnel. On behalf of the Swedish Transport Administration (STA), SP Fire Research in Norway has tested what effects the system has on ventilation air flow rates in the tunnel. This is a question that has been raised by many, but which has not been answered before now.
When a fixed fire‑fighting system is activated in road tunnels, it is normally over one or several sections. In ordinary buildings, automatic sprinklers are used, meaning each individual sprinkler is being activated by the heat from a fire. However, this is not possible in road tunnels, as high longitudinal air flow rates make it difficult automatically to activate the sprinklers that are directly above the fire. The response is therefore to activate 50 m or 75 m sections in the vicinity of the fire.
These deluge sections are activated manually, depending on the information provided by the detection system in terms of positioning the fire. In most cases, it is sufficient to open one section, but if there is uncertainty concerning the location of the fire or if it lies between two sprinkler sections, two sections may be opened.
The Effect on Air Flow
When a 75-m sprinkler deluge section is activated, it will presumably create a certain back pressure on the ventilation system. The body of air must be pressed through and past the curtain of water created by the fire‑fighting system in the tunnel. The magnitude of this back pressure is a question that many designers have asked, particularly those responsible for designing ventilation systems. There are no simple methods of calculation for determining its magnitude. In certain cases, it can be calculated using advanced flow models, but there is considerable uncertainty over how they should be used. By far the simplest way of obtaining the information is to conduct tests on site in a real road tunnel.
Tests in the Northern Link Tunnel
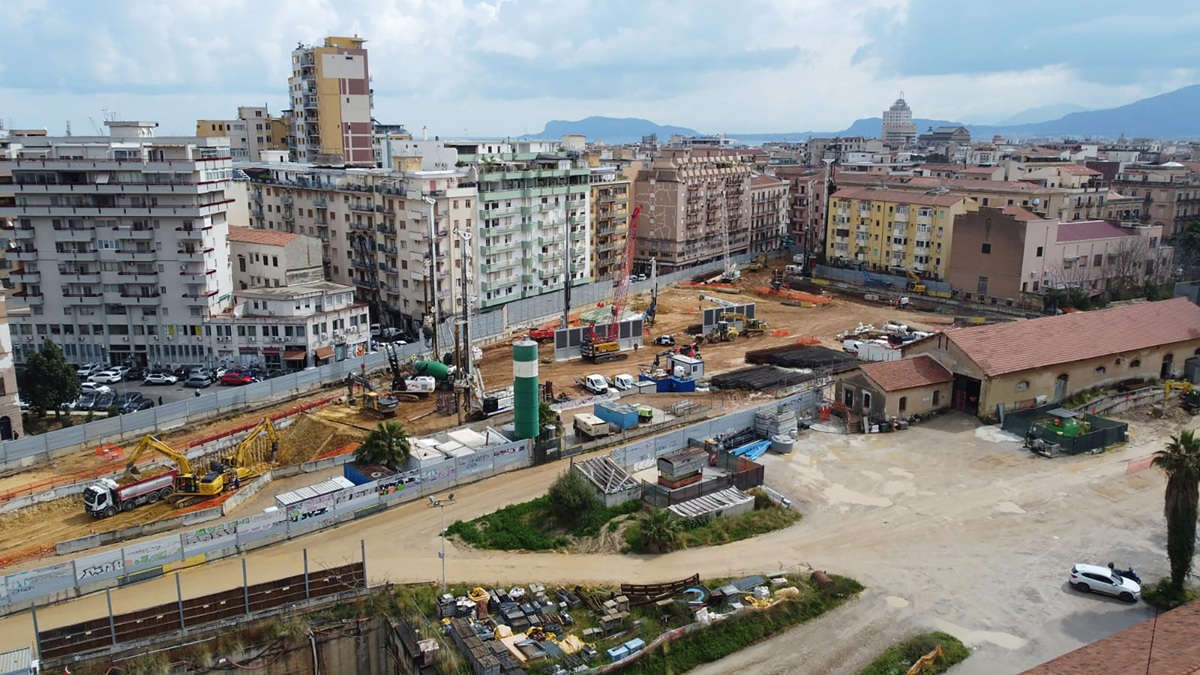
The STA carried out four tests together with SP Fire Research. The air velocity in the tunnel system was measured using hand‑held air velocity meters, in conjunction with the measurement system permanently installed in the Northern Link tunnel, consisting of velocity sensors mounted close to the roof of the tunnel. The measurements with the fire‑fighting system in operation were performed in the Roslags tunnel, which has a cross‑section 12 m wide and 6.6 m high. Figure 1 shows two sprinkler sections in operation.
Air velocities were measured about 20 m upstream of the area over which the system had been activated and about 50 m downstream of it, using the hand‑held instruments at a height of 1.7 m above the road surface. The velocity meters used by the tunnel system were mounted close to the tunnel mouth and to the tunnel roof. Table 1 shows measured values from the STA’s system, with and without activated sprinkler sections. Both one 75 m section and two sections (i.e. 150 m in total) were activated and tested at different air flow velocities.
Little Effect
It is clear that the effect on the air velocity in the tunnel is not particularly high, being of the order of 10 to 20% of the unobstructed air velocity before activating two sprinkler sections. By compensating this reduction in fan capacity it is possible to avoid the system becoming inadequate when two sprinkler sections are in operation. The effect of the ventilation on the spread of water droplets in the tunnel is very small: the droplets fall almost vertically towards the road surface, even with a high ventilation velocity.
TABLE: Air velocities measured by the Swedish Transport Administration in the Northern Link tunnel, with and without the fire‑fighting system activated.
| Test no. | Number of activated 75 m sections |
Measured air velocity [m/s] |
Reduction in air velocity [m/s] | |
| Before activation | After activation | |||
| 1 |
Two |
2.6 | 2.4 | 0.2 |
| 2 |
Two |
5 | 4.6 | 0.4 |
| 3 |
One |
1.1 | 0.9 | 0.2 |
| 4 |
Two |
0.9 | 0.7 | 0.2 |

Comments are closed here.